In this study we will answer the question: How much frog and toad habitat is there near your school?
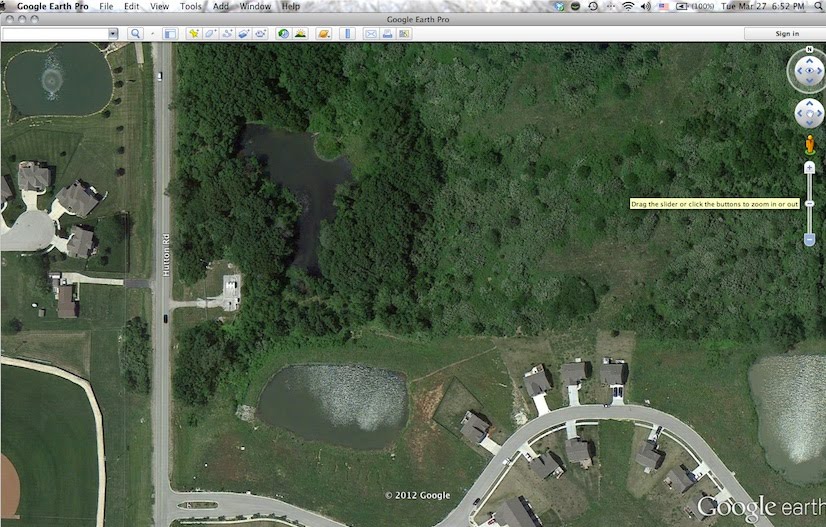
Check your habitat rating abilities by seeing how you would rate the four ponds in the image below:What would you recommend to improve the poor quality habitats that you identify? Be specific, and give suggestions for each one. Come up with a
plan and tell us how much of an increase in frog and toad habitat this would create. Calculate this in terms of both percentage increase and increase in
total area of potential frog and toad habitat.
We will use this information to put together a presentation on your plans to improve frog and toad habitat, which will go in the same Powerpoint presentation as your species descriptions (you can use screen shots of Google Earth as JPG or PNG files). A brief digression....
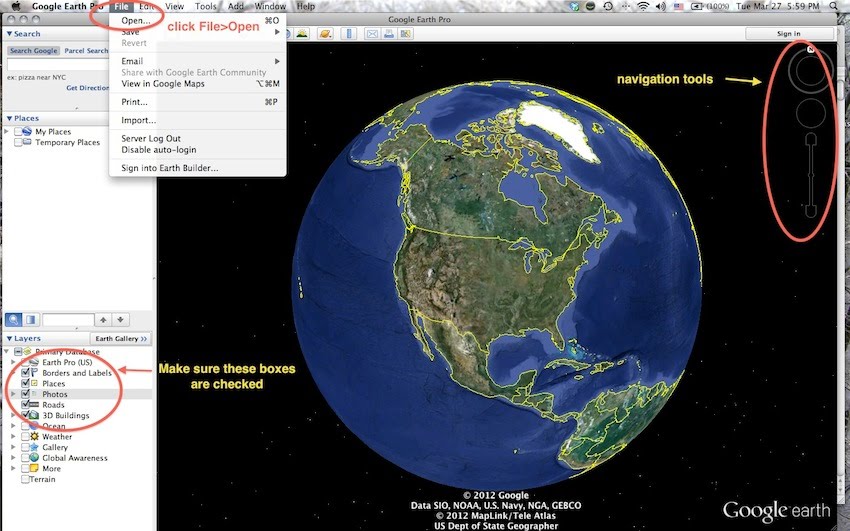
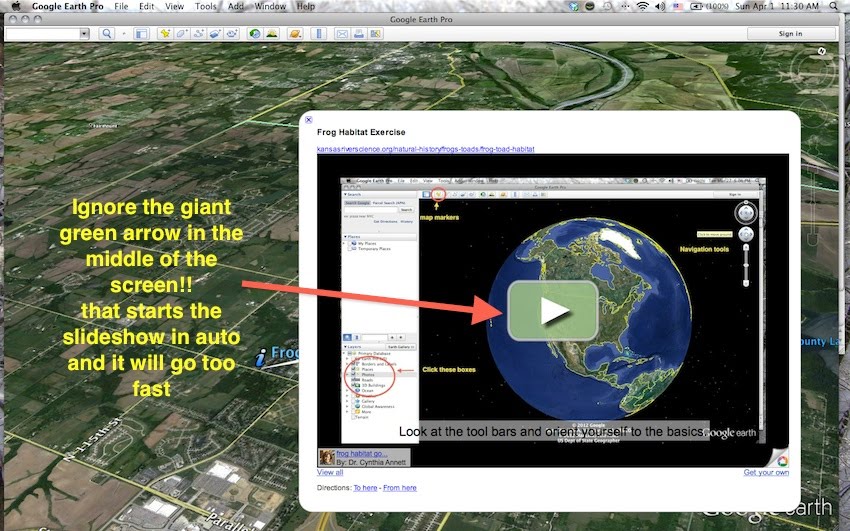
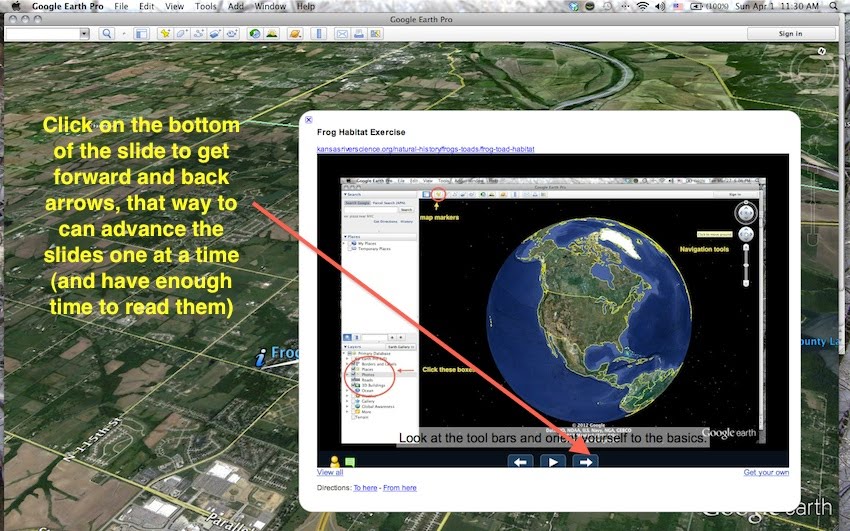
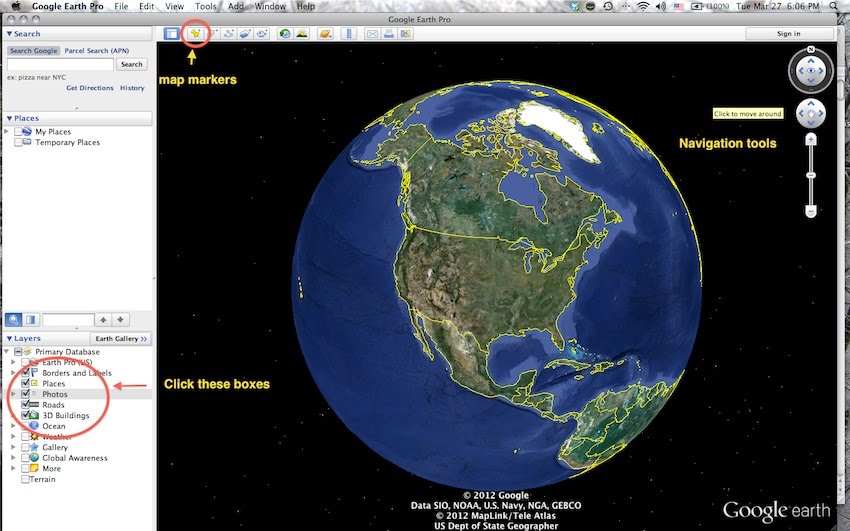
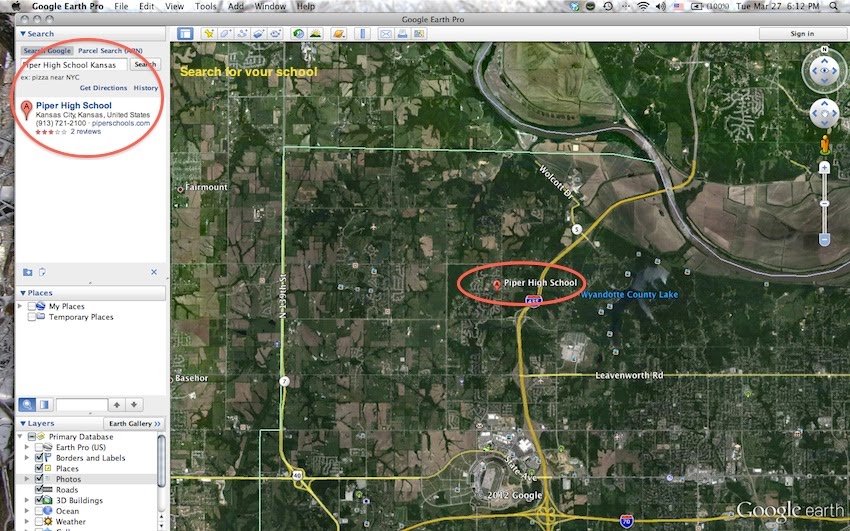
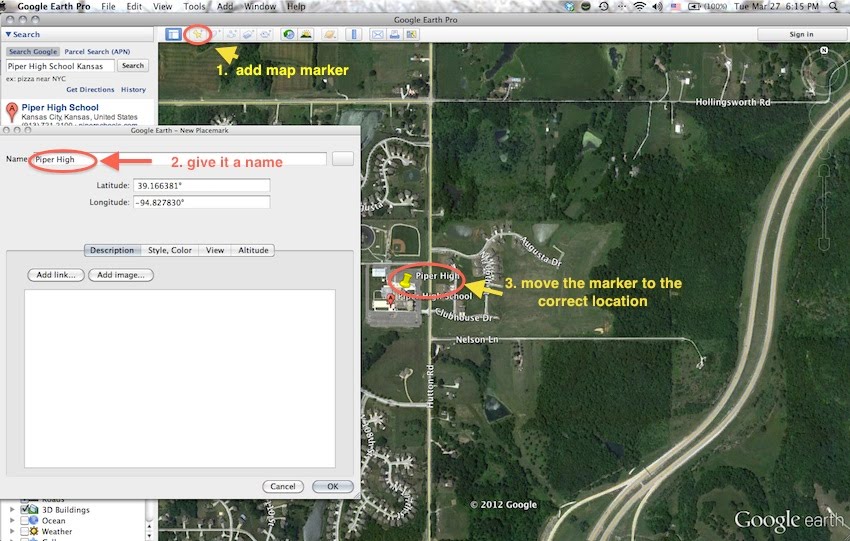
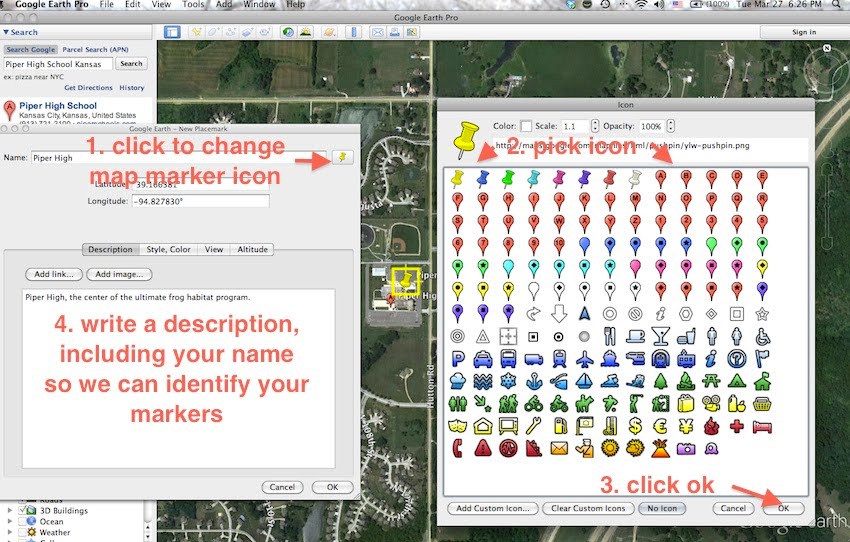
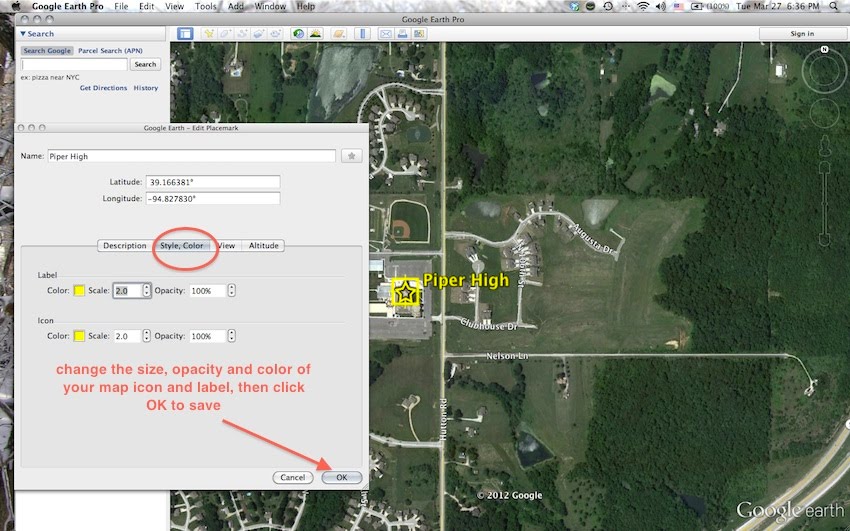
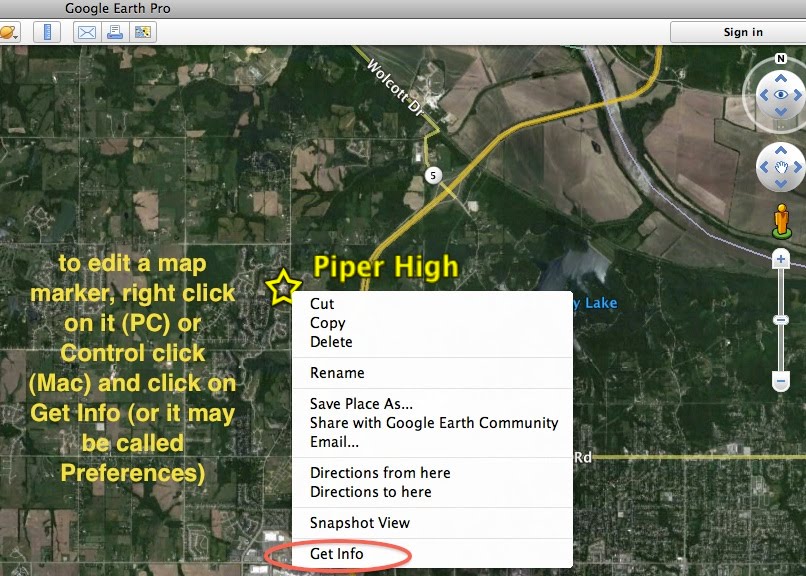
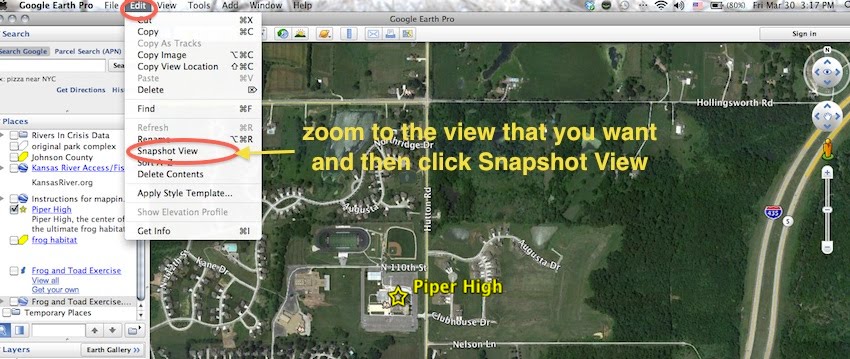
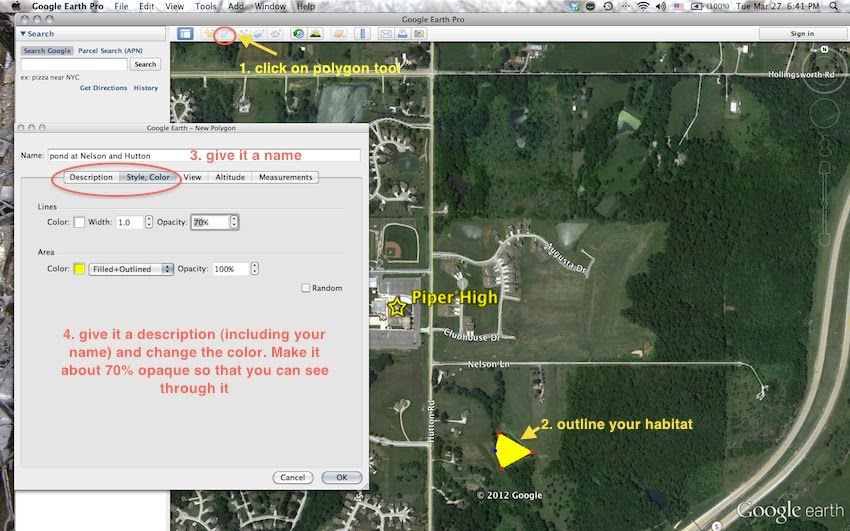
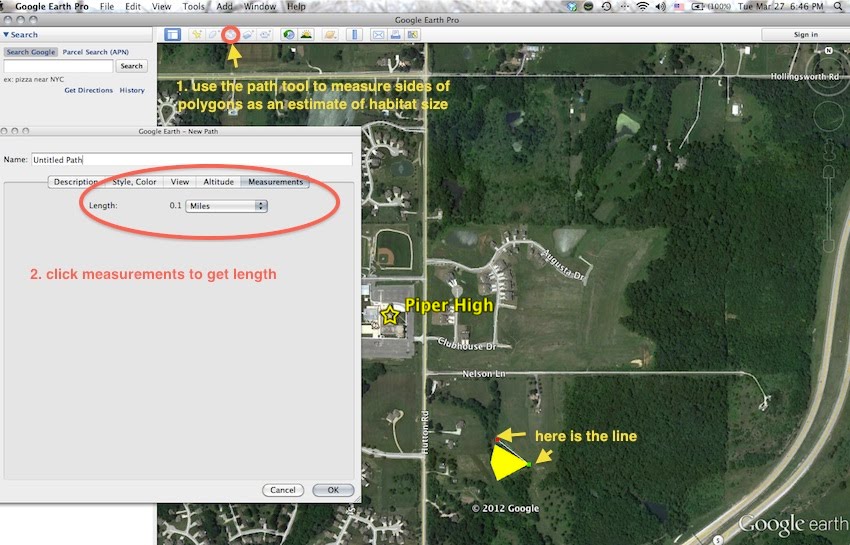
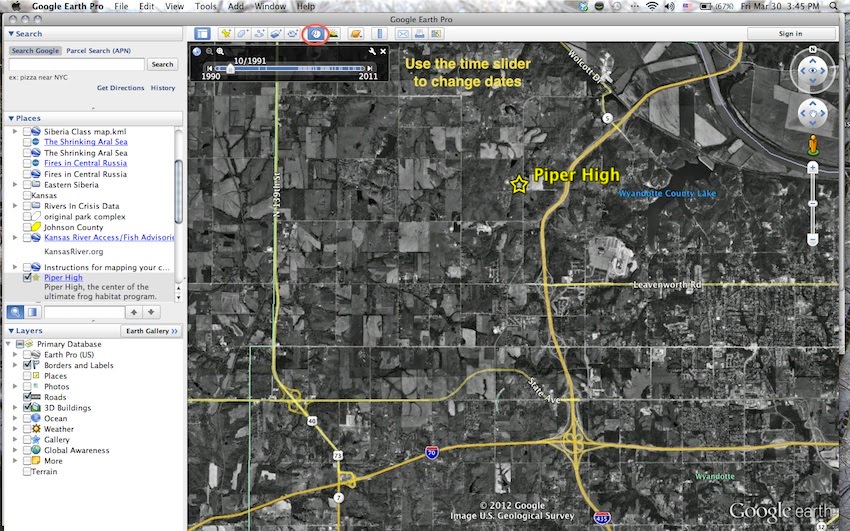
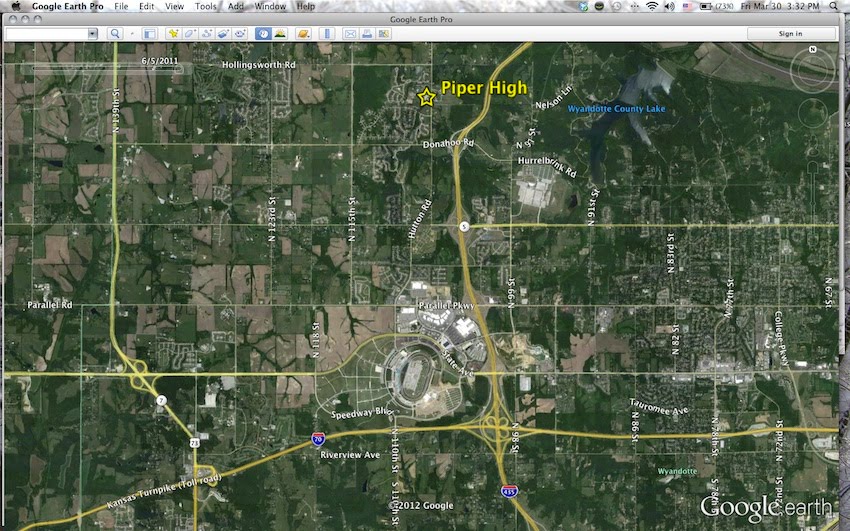
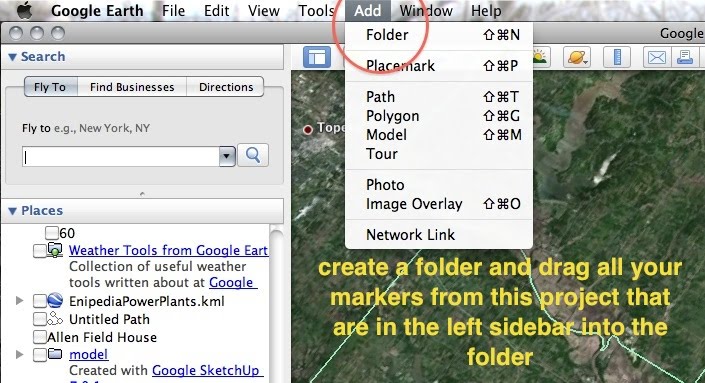
To begin, go to the attachment section at the bottom of this page and download the Google Earth kml file to your computer desktop. Now open Google Earth on your computer and click File>Open and open the file in Google Earth. The balloon should open automatically, but if it doesn't you can click on the blue "i" that appears in the map. This will give you a balloon that has all of the images you see on this page, so you can either follow along in Google Earth or use this website for instructions.Now you can either use the slideshow in Google Earth or this website for directions.The first step is to look at the tool bars labeled below and orient yourself to the basics.Find your high school.Put a map marker on your high school.Pick an icon for your marker.Change the color and size of the icon.After you save your map marker, if you want to edit it you can re-open the dialog box by right-clicking on the marker (or Control Click for Macs).If you want to have the viewer see the place that you have marked in a certain way, get into edit mode for the map marker and then you can set the altitude and angle of view by clicking Edit>Snapshot View.Use the polygon tool to show where your habitats are.Use the path tool to measure the length and width of the habitat, then calculate an approximate area.Now let's do a little time traveling. Click on the Clock in the toolbar and use the time slider to change the satellite imagery to older dates (if you use different map markers and Snapshot View you can set the dates that the viewer sees).Compare 1991 to 2011 to determine how much habitat has been lost or deteriorated in quality.Now put everything into a folder so that you can save it.Save your work!!You will need to click on the folder in the sidebar (not just on one of the markers) when you save to make sure that you are saving all of your work (your map consists of lots of different pieces).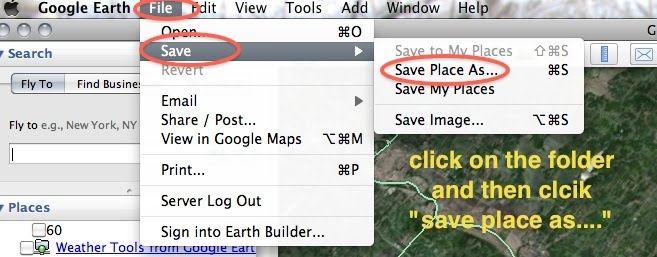 You can use screen shots to insert images into your slideshow to combine your species survey with recommendations on habitat improvement and conservation. Do you think it is possible to implement some of your ideas? Try using Google SketchUp to create a Frog Park that you can use to advocate for your habitat project. |
Natural History > Frogs and Toads >


