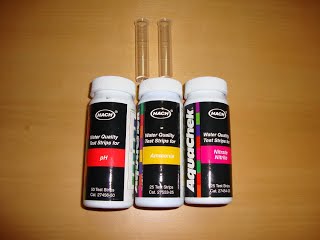
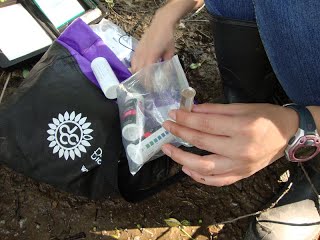
Title: Water Testing - NitrogenOverview- Presentation to studentsNitrogen is a very common element. It is present in our water, our air, in plants and animals, and in us. Small amounts of nitrogen are essential to the life, growth, and reproduction of all organisms. Because nitrogen is so important to help organisms grow, fertilizers containing nitrogen are often applied to crops, lawns, gardens and golf courses. (Best Management Practices for suburban and urban developments can be found on the Friends of the Kaw main website.) When it rains, this fertilizer is washed into rivers, streams, lakes, and ponds. Nitrogen is also present in the waste of warm-blooded animals, such as cows and humans, and can enter the water in waste from pastures and leaky septic systems. Storm runoff from dog kennels or cat litter box dumping and wildlife feces contribute a small amount of nitrogen in the environment. Even fish waste contains nitrogen! Large farms are generally required to have ponds or lagoons to catch manure and fertilizer runoff before it enters streams and rivers. They are also required to keep field records of land application. Best management practices for manures and fertilizers include split application (put on small amounts several times rather than a large amount all at once), incorporating the nitrogen source into the soil instead of simply laying it on top (till after application or inject into the soil), and avoiding winter application when plants are not present or active in taking up the applied nitrogen. To avoid livestock manure running off fields into surface water, it is recommended to leave a buffer of unmown grass and trees (a riparian buffer) near streams to act as a filter. (Best Management Practices for agriculture can be found on the Friends of the Kaw main website.) Nitrogen washing into streams and ponds from the above sources is typically in one of three inorganic forms: ammonia (NH3), nitrite (NO2), or nitrate (NO3). Once these forms of nitrogen are present in an aquatic system, bacteria will convert the ammonia to nitrite, and the nitrite to nitrate. Nitrate is the form available to be used by plants. Once the nitrogen is in the nitrate form, it is rapidly taken up by algae and other aquatic plants. Because algae out-competes most other aquatic plants and can take in such a large amount of nutrients, we often see algal blooms in bodies of water with a recent inputs of nutrients. When this overgrowth of plants dies, the decomposition process uses up most of the oxygen in the water. This can lead to fish and other aquatic life leaving the area or suffocating to death. The test strips we will use will detect ammonia, nitrite and nitrate. The water may also contain a significant amount of nitrogen as organic matter, or in living organisms. The tests we will use will not detect these forms. If all of the nitrogen has been converted and taken up by plants, the tests will detect no available nitrogen, although it may be present in other (unavailable) forms. Because nutrients are absorbed so quickly by algae and other plants, it is best to get a water sample just after a runoff event, such as a rainstorm. Water that has been standing for a couple of hours or more will likely have little to no inorganic (available) forms of nitrogen to detect. There are tests for organic forms of nitrogen (that which has been taken up by plants and other organisms), but they are typically more complicated and expensive than tests for the inorganic (available) forms. Grades: High School Kansas Grade Level Expectations – Standards/BenchmarksEnvironmental Education Grade Standard 3, Benchmark 4 Standard 3, Learners investigate and analyze the relationships among resources, technology, and the environment. Benchmark 4 Learners identify and evaluate environmental issues from multiple points of view. 1. identify the various uses of soil and water in Kansas. Example: Watering lawns and irrigating fields. 2. identify the risks and benefits that agriculture, petroleum production, manufacturing, energy production, human communities, and other economic development activities can have on soil and water in Kansas. Example: Fertilizers used by agriculture and golf courses causing eutrophication of streams. Environmental Education Standard 4, Benchmark 1 ssary to conduct scientific inquiries. 9-12 Benchmark 1: Learners demonstrate scientific questioning skills. 9-12 Indicator: By the end of the twelfth grade, the students: 1. identify an environmental topic to be studied using primary and secondary sources of information, and pose a research question or hypothesis, identifying key variables. Example: Select a river or stream to investigate for water quality. Have the students go to various sources (libraries, government agencies, the Internet, etc.), collect information (from books, journals, pamphlets, etc.) and write a review of literature (with citations) regarding water quality issues variables; develop hypotheses; collect, organize and analyze information/data through surveys, interviews, experiments, or other means. 2. select appropriate measurement strategies, which may include models and simulations. 3. collect data through surveys, interviews, experiments, or other means. 4. consider relationships among variables, develop insightful interpretations, and examine evidence for support or non‑support of the hypothesis. Example: Identify a local environmental issue that can be tested using science process skills. Develop an open-ended problem question and design and conduct an investigation to test the question. E.g., investigate the effects of XYZ sewage treatment plant on ABC Creek. After completing the investigation, evaluate the processes used and the reliability of the results. Environmental Education Standard 4, Benchmark 2 Standard 4: Learners develop the abilities necessary to conduct scientific inquiries. 9-12 Benchmark 2: Learners demonstrate scientific inquiry skills. 9-12 Indicators: By the end of the twelfth grade, the students: 1. connect questions with appropriate means of inquiry, including scientific investigations, historical inquiry, and social science observation and research. 2. use sampling techniques, e.g., spatial sampling and random sampling. 3. apply observation and measurement skills in field situations, e.g., interview community members about environmental issues. 5. perform basic statistical analyzes to describe data using quantitative measures, e.g., mean, median, mode, variability, probability, etc. Example: After the students have completed their review of literature of stream quality, have them select four sites on a local stream for purposes of conducting a scientific investigation. Measure the following parameters: physical (width, depth, flow of current), biological (vertebrates and invertebrates), and chemical (dissolved oxygen, nitrates, phosphates). Compare the results to historical records and to state water quality standards. See whether there are any significant differences between sites (using graphs, statistical tests of significance, maps). Compare and contrast how possible changes in chemical parameters may change biological parameters. Students can brainstorm other possible investigations related to their stud 9-12 Benchmark 1: Learners demonstrate scientific questioning skills. 9-12 Indicator: By the end of the twelfth grade, the students: 1. identify an environmental topic to be studied using primary and secondary sources of information, and pose a research question or hypothesis, identifying key variables. Example: Select a river or stream to investigate for water quality. Have the students go to various sources (libraries, government agencies, the Internet, etc.), collect information (from books, journals, pamphlets, etc.) and write a review of literature (with citations) regarding water quality issues variables; develop hypotheses; collect, organize and analyze information/data through surveys, interviews, experiments, or other means. 2. select appropriate measurement strategies, which may include models and simulations. 3. collect data through surveys, interviews, experiments, or other means. 4. consider relationships among variables, develop insightful interpretations, and examine evidence for support or non‑support of the hypothesis. Example: Identify a local environmental issue that can be tested using science process skills. Develop an open-ended problem question and design and conduct an investigation to test the question. E.g., investigate the effects of XYZ sewage treatment plant on ABC Creek. After completing the investigation, evaluate the processes used and the reliability of the results. Environmental Education Standard 4, Benchmark 2Standard 4: Learners develop the abilities necessary to conduct scientific inquiries. 9-12 Benchmark 2: Learners demonstrate scientific inquiry skills. 9-12 Indicators: By the end of the twelfth grade, the students: 1. connect questions with appropriate means of inquiry, including scientific investigations, historical inquiry, and social science observation and research. 2. use sampling techniques, e.g., spatial sampling and random sampling. 3. apply observation and measurement skills in field situations, e.g., interview community members about environmental issues. 5. perform basic statistical analyzes to describe data using quantitative measures, e.g., mean, median, mode, variability, probability, etc. Example: After the students have completed their review of literature of stream quality, have them select four sites on a local stream for purposes of conducting a scientific investigation. Measure the following parameters: physical (width, depth, flow of current), biological (vertebrates and invertebrates), and chemical (dissolved oxygen, nitrates, phosphates). Compare the results to historical records and to state water quality standards. See whether there are any significant differences between sites (using graphs, statistical tests of significance, maps). Compare and contrast how possible changes in chemical parameters may change biological parameters. Students can brainstorm other possible investigations related to their study. Materials1. Water sample 2. Nitrite/Nitrate test strips 3. Ammonia test strips
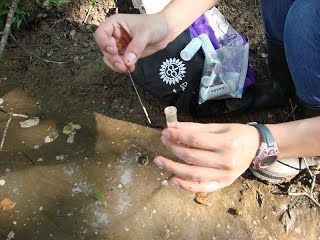
Methods – Nitrate + Nitrite strips1. The strips have two pads, one that tests nitrate on a scale of 1-50 ppm, and one that tests nitrite on a scale of -.15 to 3.0 ppm. In laboratory tests, these two values are usually added together and reported as Nitrate + Nitrite. *Be sure to store the extra strips in a dry place with the lid tightly closed. 2. Dip a strip into your sample for 1 second. Be sure both pads are submerged. Do not leave the strip in the sample to soak, and do not shake excess water from the strip. 3. Hold the strip level or place on a dry paper towel with the pads facing up. After 30 seconds, you may read the nitrite test on the second pad. Compare the color to the nitrite color spectrum on the jar. 4. After 60 seconds, you may read the nitrate test on the tip of the strip. Compare the color to the nitrate color spectrum on the jar. 5. Leave the strip undisturbed for about 2 minutes, and read the results again. This is the maximum intensity color, which corresponded more closely with laboratory results. This is the result you should record in your field notebook. 6. Record the value and determine a rating based on the table below.
Nitrate
Nitrite
Methods – Ammonia strips
*Be sure to store the extra strips in a dry place with the lid tightly closed.
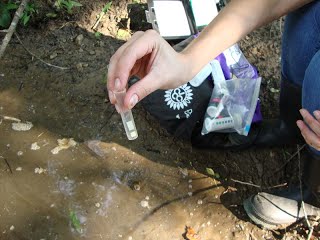
2. Fill the sample vial to the top line with the water sample. 3. Dip the strip into the water sample. Vigorously move the strip up and down in the water sample for 30 seconds, making sure both pads are always submerged.
4. Remove the test strip and shake off excess water.
5. To read the strip, turn the test strip over so that both pads are down, and hold it so that the pads are facing away from you. It helps to have good lighting reading the strip.
6. Compare the color of the small pad to the color chart on the bottle. Read the result through the clear plastic of the test strip.
*Note: these samples also change after 30 seconds, but in our experience, they become less accurate if you wait. Read these at
the time intervals stated on the bottle, after 30 seconds in the water, plus 30 seconds out of the water, for a total of one minute.
7. Rinse the sample vial with distilled water after each use and drain.
8. Read the Interpretation section to determine the value and determine a rating based on the table below.
*Note: For this test, we recommend also running a side-by-side sample with distilled water. For some reason, we often get a low level ammonia reading (0.25 or lower) with this test, even in distilled water. If this is the case when you run your test, subtract the level obtained with distilled water from the level obtained from your sample water. At high pH and high temperature, even a small amount of ammonia nitrogen can be toxic, so it is important to be accurate even at low concentrations.
Ammonia
Interpreting your resultsAmmonia has acute and chronic toxic affects on aquatic life. To calculate whether the level in the
water is toxic at the acute or chronic level, you
must also know the temperature and pH of the
water. Refer to the physical parameters lesson for instructions on measuring temperature and pH. Once you have all of the necessary measurements, you may refer to tables 4-1 and 4-2 below to determine the toxicity level of your sample.
|
|
|


