Title: Nutrient Runoff ExperimentThis lesson was created by Diana Restrepo
Original idea for experimental set up by Carmenza Osorio
Videotaped by Camilo Bohorquez
OverviewIn Kansas, most of the runoff that drains into rivers and streams comes from agricultural land. Cropland and pastures generally contain large amounts of fertilizers and manure, as well as harmful pesticides and herbicides. Stormwater runoff is called non-point source pollution and includes water that runs over lawns, driveways, agricultural fields, and roads during a rainstorm. This runoff does not get treated in water-treatment plants, instead running untreated into rivers and streams. In the US, non-point source pollutants are the most difficult to control and are the leading cause of water pollution. In contrast, point source pollutants are those that drain into a river from a location such as a pipe or a ditch. These carry water from businesses, residencies, factories, power plants, sewage treatment plants, and combined stormwater and sewage outfalls. Phosphorous is a nutrient that is found naturally in water bodies. It forms the building blocks for important biological processes in all aquatic organisms. When nutrients like phosphorous rise to abnormally high levels, the balance of the water ecosystem is disturbed. For example, when high levels of nutrients such as nitrogen and phosphorous are carried by stormwater runoff to a water body, organisms such as green algae take these nutrients and grow out of proportion. When the algae decay, they use oxygen available in the water and animals such as fishes that use oxygen to breathe die. We can also be affected by high nutrients since traces of a chemical produced by algae called geosmin may remain present in the water even after it is treated and make our drinking water taste or smell earthy or musty. Pollution from stormwater runoff can be reduced in two ways. First, when you apply fertilizers to agricultural fields or lawns, be careful not to apply more than is needed. Second, avoid applying fertilizer right before a storm. When fertilizer is applied before a storm, plants do not have time to use it and the fertilizer left in the soil can be washed off with the rain. When this happens the phosphorous level in the water increases. Being careful about the way fertilizers are applied to agricultural land and residential lawns could greatly reduce the nutrient input to streams, rivers and lakes. Grades: High SchoolLearning ObjectiveTo demonstrate the effects of being careless when applying fertilizer to agricultural land and/or residential lawns. Kansas Grade Level Expectations – Standards/BenchmarksSTANDARD 3: Learners demonstrate an understanding of the varied roles and interactions between humans and the environment.Benchmark 4: Learners identify and evaluate environmental issues from multiple points of view. Indicators: STANDARD 4: Learners develop the abilities necessary to conduct scientific inquiries. Benchmark 2: Learners demonstrate scientific inquiry skills.
Materials:
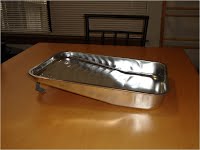
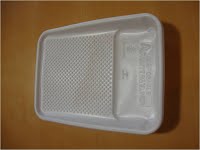
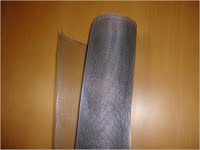
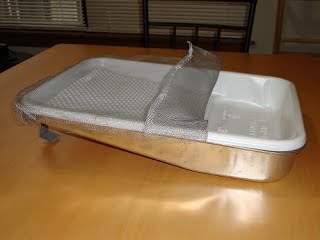
Method:1-Use the scissors to cut a piece of mesh that covers the inside area of the tray liners. 2-Bend approximately 3 inches of one side of the mesh. 3-Place the liner on the metal paint tray .
4-Place the mesh piece on the liner with the bend end towards the bottom part of the tray (the part that is not raised- where the paint would collect).
5-Fold the surrounding upper part of the mesh around the raised part of the set up.
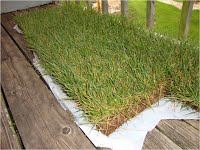
6-Turn the sod so that the soil and roots are facing upwards. Use the measuring tape to measure a 6”x10” piece. Safely use the exacto knife to cut the piece, this process might require you to run the knife several times through the same cut before the piece of sod is released.
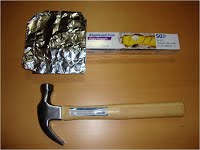
7-Place the 6”x10” piece of sod on the mesh, making sure that one of the pad’s sides rests against the bent side of the mesh. 8-Cut an ~8”x10” piece of aluminum foil and fold it in half two times 9-Place 3 fertilizer pellets inside the foil “booklet” and crush the pellets with a hammer until you obtain a fine powder
10-Sprinkle the fertilizer on top of the piece of sod making sure to cover evenly the whole area
| ||||||||||||||||||||
|
pH RATING | |||
|
4-Best |
3-Good |
2-Fair |
1-Poor |
|
The water pH is between 6.5 and 8.5 |
n/a |
n/a |
The water pH is lower than 6.5 or higher than 8.5 |
Interpreting your results:
pH allows you to compare a water sample’s pH to the neutral standard pH 7. According to the Kansas Department of Health and Environment (KDHE), the pH levels in a water sample should be between 6.5 and 8.5.
Minerals present in soil, streambeds, or the bottom of a lake dictates the starting pH and the buffer capacity.
Acid rain, decaying plant matter, and mining sites close to the target body of water can greatly decrease the pH level of runoff. Making the water more acidic.
Limed fields, driveways, and roadways with limestone rock decrease the pH levels making the water body more basic highly toxic to fish.
PHOSPHOROUS:
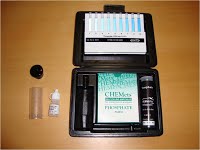
You can also test the water for phosphorous by following the protocol for Phosphorous under the Water Testing 2: Nutrients.
REFERENCES
1. Wang, S.H., Kansas Biological Survey, and Lawrence (KS). Dept. of Utilities. Assessment of Clinton Lake and its watershed : water quality and plankton communities in Clinton Lake, Kansas, May 1997 through November 1998. Kansas Biological Survey report. 2000, Lawrence, Kan.: Kansas Biological Survey, University of Kansas. xi, 95 leaves.
2. Janke, R.M., Rebecca; Powell, Morgan, Citizen Science Water Quality Fact Sheet, PK-13 W-9 Stream Site Assessment, in Kansas State University Agricultural Experiment Station and Cooperative Extension Service, K.S. University, Editor. 2006: Manhattan, Kansas.


